
SciFig
SciFig is an AI scientific figure generator that turns a sentence, sketch, lab photo, PDF, reference image or CSV and Excel data into editable illustrations, publication-grade charts and flowcharts. Figures stay layered, so labels and arrows can be corrected after generation, and export as SVG, editable PPTX, 8K PNG, PDF, EPS or TIFF, with a free per-figure publication licence.
What is SciFig?
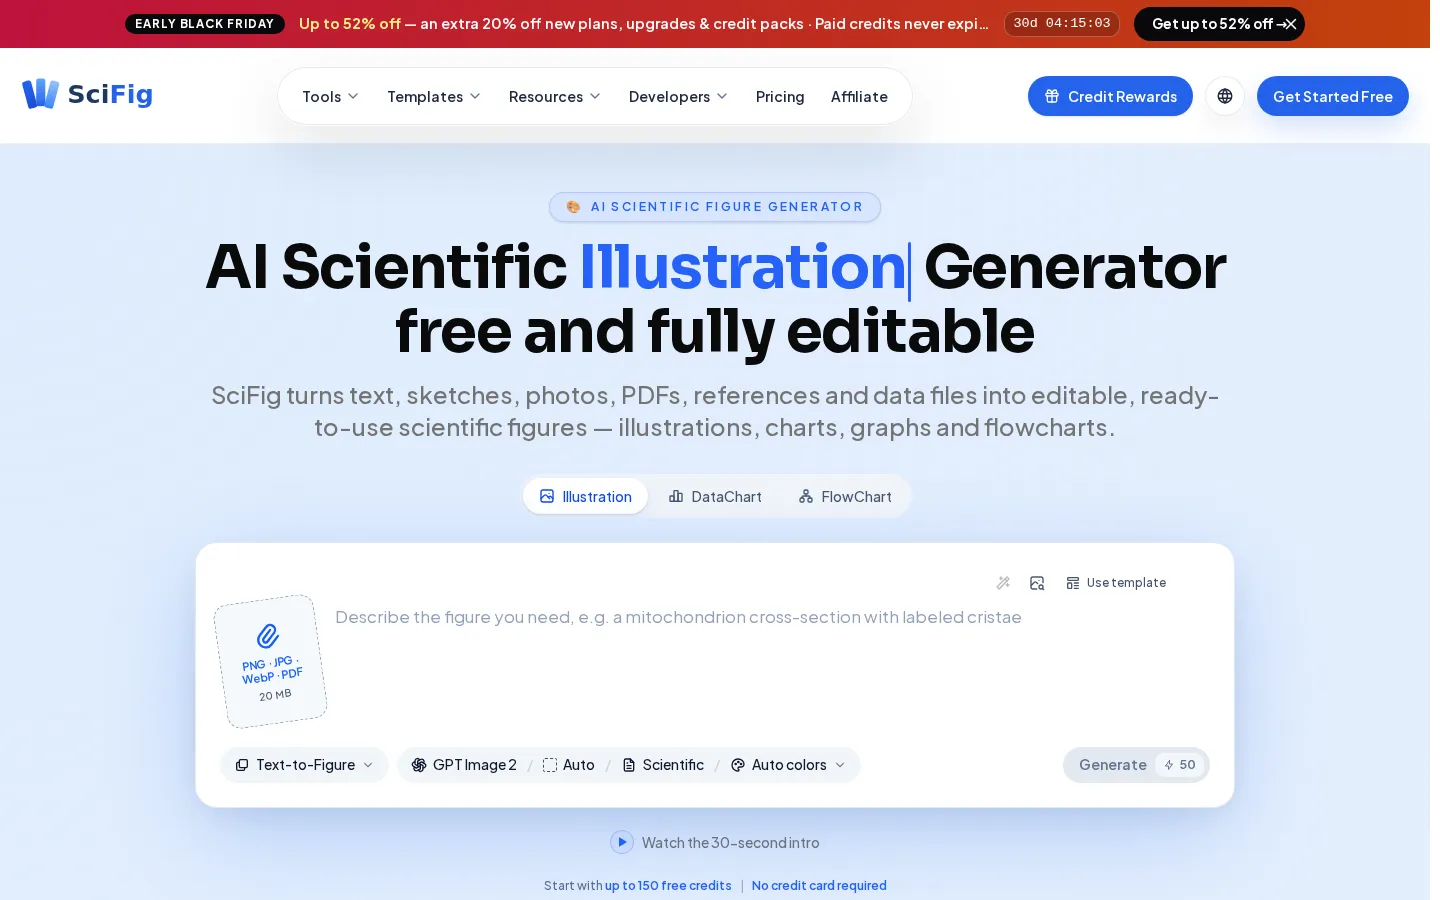
SciFig is a browser-based AI scientific figure generator that turns text, sketches, photos, PDFs, reference images and data files into editable, publication-ready figures: illustrations, charts and flowcharts. It is built for research rather than general image making, pairing generative image models with chart plotting from real numbers and native vector editing, so a figure can be corrected label by label instead of regenerated from scratch. Nothing is installed, and the free plan needs no card.
The product is organised into three workspaces. Illustration covers mechanisms, pathways, graphical abstracts, cross-sections and medical or molecular artwork, and accepts five input types plus a Figure Enhancer for cleaning up an existing image: Text-to-Figure, Sketch-to-Figure, PDF-to-Figure, Photo-to-Figure and Reference-to-Figure. DataChart takes a CSV, TSV or Excel upload and plots one of 50 chart types, including volcano plots, Kaplan-Meier survival curves, forest plots, heatmaps and ROC curves, in Nature, Science, Cell, PLOS or ACS-inspired styling with colorblind-safe palettes, and each chart ships with its statistics and the Python code that drew it. FlowChart turns a described process into an editable diagram, covering PRISMA and CONSORT study flows, model architectures, cycle diagrams and timelines with movable boxes and arrows. A fourth surface, Vector Canvas, converts any result into layered, editable SVG.
Templates and palettes shorten the blank-page problem: the site advertises 500+ starting points, split across 331 illustration, 148 flowchart and 50 chart templates, plus 28 illustration palettes, 16 flowchart themes and 14 colormaps, including journal-inspired NPG and AAAS sets and colorblind-safe Okabe-Ito. A library of 150 free single-purpose tools, from Lewis dot structures to PRISMA flows, opens the matching workspace with a worked example.
Editing is the differentiator the site leans on hardest. Every label, arrow and shape stays a separate object, so a mislabelled protein or a wrong count is a one-click fix rather than a fresh generation. A single vectorize step, charged once per figure, unlocks the Canvas editor, SVG output for Illustrator, Inkscape, Figma or Affinity, and an editable-shape PPTX. Exports include PNG and JPG at generation resolution, PDF, EPS and TIFF for charts, 8K PNG upscales for posters and covers, and a free per-figure publication licence PDF with a unique number and QR verification.
Generation runs on six image models, including GPT Image 2, Nano Banana 2.1 and Nano Banana Pro, priced at 50, 75 or 100 credits per figure, while DataChart and FlowChart cost 100 credits per generation. A free plan grants 150 credits on day one plus daily check-in credits, and paid plans start at $8.33 per month billed yearly. SciFig reports 100,000+ researchers across 11 supported disciplines.
SciFig Core Features
Three workspaces
Illustration, DataChart and FlowChart each open a dedicated editor, and anything they produce can be finished in the shared Vector Canvas.
Five illustration inputs
Text, sketch, PDF, photo and reference-image modes turn whatever you already have into a first draft, with a Figure Enhancer for existing images.
Data-accurate charts
Upload CSV, TSV or Excel data and plot 50 chart types with journal-inspired styles, colorblind-safe palettes, statistics and the Python code behind each chart.
Editable vector output
One vectorize step per figure unlocks layered SVG and an editable-shape PPTX, plus a canvas where every label, arrow and shape is its own object.
Publication-grade exports
PNG and JPG at generation resolution, PDF, EPS and TIFF for charts, and one-click upscales to 2K, 4K or 8K for posters and covers.
Research flow diagrams
PRISMA and CONSORT study flows, model architectures, cycle diagrams and timelines are laid out with movable boxes, arrows and counts.
Per-figure publication licence
A free PDF certificate with a unique number and QR verification accompanies each figure, and stays valid after a subscription ends.
Six image models
GPT Image 2, Nano Banana, Nano Banana 2.1 and Nano Banana Pro are selectable per figure, with premium tiers rendering at 2K.
Who is SciFig for?
SciFig is aimed at people who have to produce figures for a paper, a poster or a talk without the budget or the time for a professional illustrator. Academic researchers and principal investigators are the core audience: a multi-panel manuscript figure can be drafted, corrected and vectorised in an afternoon instead of a week of back and forth, and the editable PPTX output fits the revision loops reviewers force. Graduate students and postdocs get the biggest break, because the free tier's 150 day-one credits and daily check-ins cover a thesis chapter without a card, and the per-figure costs are small enough to absorb on a student budget. Lab managers and research coordinators use FlowChart for PRISMA and CONSORT study flows, which otherwise eat half a day per protocol, and for methods diagrams every collaborator can revise on the same canvas. Educators and lecturers build free-body diagrams, circuit schematics, cell cycle charts and pathway slides that stay editable between semesters, while science communicators and journal editors use Illustration for graphical abstracts and cover art that has to read at a glance. Industry R&D teams in biotech, pharma, materials and engineering bring their own data to DataChart, plotting dose-response curves, survival analyses or spectroscopy series in journal style with the statistics attached. A quieter group is the design-adjacent scientist who already owns Illustrator or Inkscape: the layered SVG route lets SciFig serve as a fast draft generator feeding a familiar toolchain. It fits less well if you need shared team seats with a common asset library, a fixed institutional symbol catalogue, or guaranteed anatomical correctness without expert review. The output still needs a scientist to check every label and relationship, and institution-wide billing is handled by a sales conversation rather than self-serve seats.
SciFig Use Cases
Draft a graphical abstract for a journal submission from a two-sentence description of the mechanism.
Turn a whiteboard sketch of a signalling pathway into a clean, editable vector figure.
Plot a volcano plot or Kaplan-Meier curve from a CSV of your own experimental results.
Build a PRISMA screening flow with accurate counts for a systematic review manuscript.
Redraw a rejected figure's labels and colours in PowerPoint after reviewer comments.
Generate free-body diagrams and circuit schematics for lecture slides each semester.
Convert a lab photo of your rig into a labelled schematic for a methods section.
Upscale a finished figure to 8K for a conference poster or journal cover.
SciFig Pros and Cons
Pros
- Output stays editable at the object level, so a single wrong label costs one click rather than a full regeneration.
- Charts are plotted from your uploaded data across 50 types, so values stay traceable instead of being invented by an image model.
- The free tier is usable without a card: 150 credits on day one plus daily check-ins, and paid credits never expire.
- Paid plans start at $8.33 a month billed yearly, far below the $200-400 an illustrator charges for one figure.
- Every figure gets a free licence PDF with QR verification, which most AI image tools cannot offer a journal.
Cons
- Scientific accuracy still depends on you: structures, labels and relationships need expert checking before submission.
- The most useful inputs are gated: Reference, PDF and Photo-to-Figure plus 8K upscales start at the $24/month Plus tier.
- There is no self-serve team workspace or shared asset library; institutional billing is a sales conversation.
FAQ About SciFig
SciFig Pricing
SciFig is freemium with three paid tiers. The free plan costs nothing, needs no card, and gives 150 credits on day one plus daily check-in credits of up to 150, with 1K generation and 2K upscales. Starter is $8.33 per month billed yearly at $100, or $19.90 month to month, with 1,200 credits a month, Sketch-to-Figure, 2K generation, 4K upscales and vector export. Plus is $24 per month billed yearly at $288, or $29.90 monthly, with 4,000 credits and the PDF, photo and reference inputs plus 8K upscales. Pro is $30 per month billed yearly at $360, or $49.90 monthly, with 8,000 credits and ten parallel generations. Paid credits never expire, one-time credit packs also exist, and a Black Friday promotion currently takes up to 52% off a first year.
Check official pricingFree
150 credits on day one plus daily check-in credits up to 150 a day, Text-to-Figure, Figure Enhancer, DataChart and FlowChart, GPT Image 2 and Nano Banana at 1K, upscales to 2K, 1GB storage, two figures at a time, full publication and commercial rights. Sketch, reference, PDF and photo inputs, vector SVG, editable PPTX and the Canvas editor are excluded.
Starter
1,200 credits a month that roll over and never expire, all six image models including Nano Banana Pro and GPT Image 2.5, 2K generation, upscales to 4K, Sketch-to-Figure, vector SVG and editable PPTX, the Canvas editor, five figures at a time and 10GB storage. Also $19.90 month to month.
Plus
4,000 credits a month, Reference, PDF and Photo-to-Figure unlocked, upscales to 8K, five figures at a time, 50GB storage, all six image models, 2K generation, vector export and the Canvas editor. Also $29.90 month to month.
Pro
8,000 credits a month, everything in Plus, ten figures generated at once and 300GB storage, for labs producing figures every week. Also $49.90 month to month. Credit packs unlock Pro-level features while the pack balance is above zero.
SciFig Alternatives

siift
siift is an AI decision platform for founders and business teams that need a clearer direction. It maps your business on an intelligent canvas, turns assumptions into evidence-scored research, and prioritizes what to do next. A shared context system keeps strategy, actions and results aligned across teammates and outside AI assistants, so progress compounds instead of scattering.

Rogo
Rogo gives investment banks, private equity firms and asset managers a finance-specific AI workspace where hundreds of purpose-built agents draft models, memos and diligence packs from connected internal and market data, used today by more than 450 institutions, with auditable citations plus firmwide spend and policy controls.

Metaso
Metaso (秘塔AI搜索) is an AI search engine built for research-grade answers rather than link lists. It searches the open web, document libraries, and academic indexes such as PubMed, SCIE, EI, and JCR, then writes a structured, cited answer. Extra modes produce mind maps, slides, interactive web pages, and deep-research reports, and a paid Search API exposes the same index to developers.