
FigureLabs
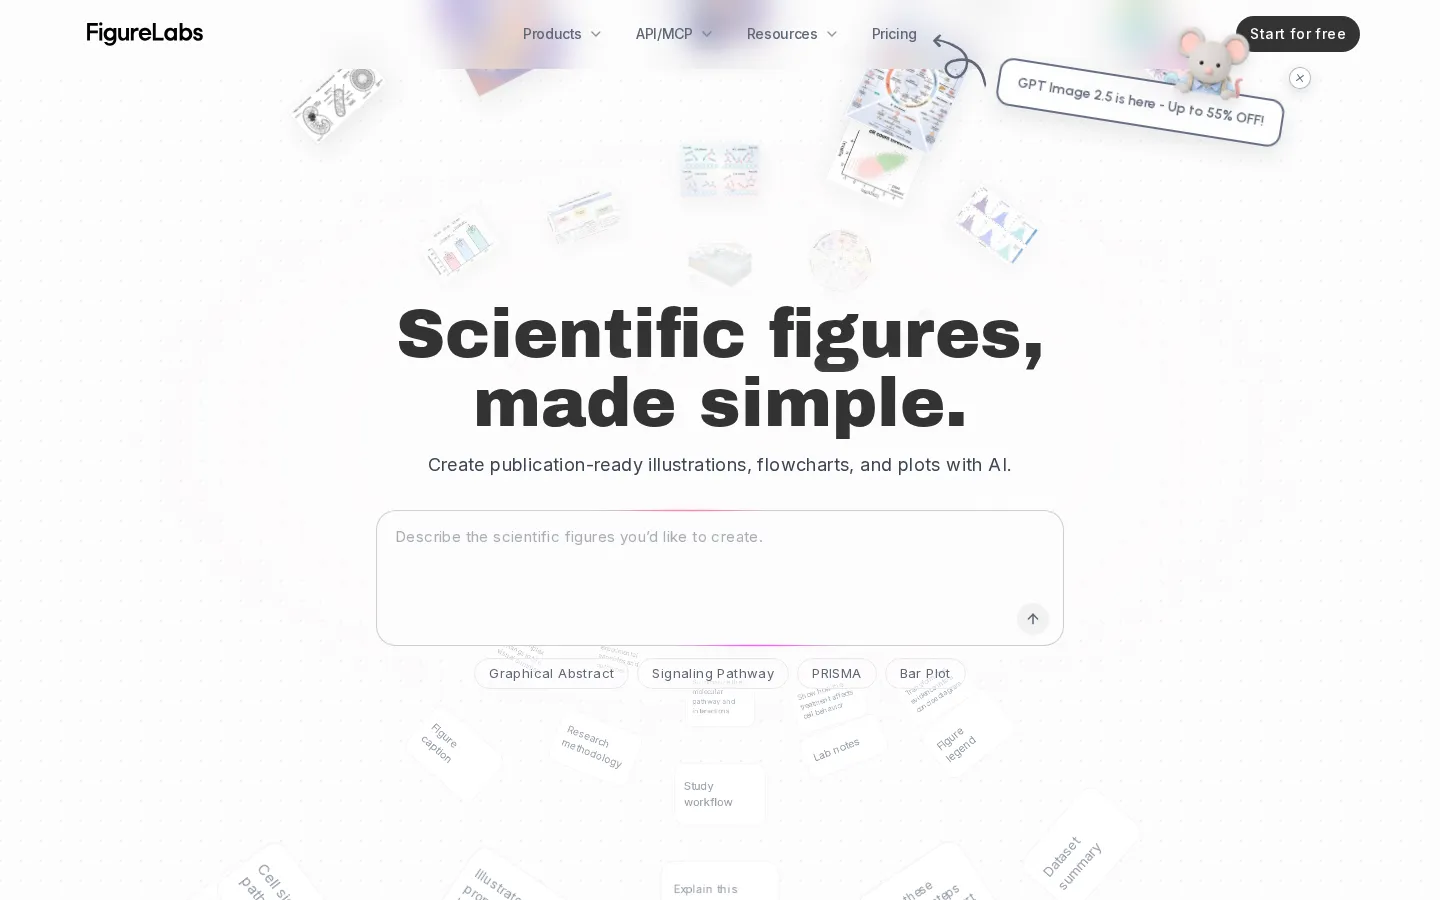
FigureLabs is an AI image generation platform built for scientists and academics. It converts text, sketches, lab photos, PDFs, CSV and Excel data into publication-ready scientific illustrations, flowcharts and plots. Generated work stays editable on an infinite canvas and exports as 8K PNG, JPG, SVG or PPTX, backed by an API and an MCP server for ChatGPT, Codex and Claude.
What is FigureLabs?
FigureLabs is an AI scientific figure generator: a web platform that turns research inputs into publication-ready illustrations, flowcharts and plots. Instead of drawing shapes by hand, a researcher describes the figure they need, uploads source material such as a methods section, abstract, PDF, DOCX, spreadsheet, lab photo or rough sketch, and the platform returns a finished scientific visual. The site frames the product around a single promise, scientific figures made simple, and supports three core modes: Illustration for graphical abstracts, pathway and mechanism diagrams, Flowchart for study designs, PRISMA and CONSORT diagrams, model architectures and process logic, and Plot for bar plots, box plots, heatmaps, volcano plots, violin plots and other journal-style charts generated from CSV or Excel data.
Generation is only part of the workflow. Every result lands on an infinite canvas where figures can be refined through conversation or direct manipulation: redraw a selected region, edit labels and text, recolor, remove backgrounds, adjust aspect ratio or upscale. Because text inside AI images is often unreliable, FigureLabs can vectorize a result into a clean, layered SVG so every element stays editable, then export as editable PPTX or SVG for Adobe Illustrator, BioRender or PowerPoint, or as high-resolution PNG and JPG up to 8K, which the site equates with roughly 1200 DPI. Figures can be shared by link for real-time collaboration, and a downloadable authorization certificate with a unique ID provides verifiable proof of rights for commercial use and top-tier journal submission.
Under the hood, FigureLabs routes each request to one of several state-of-the-art image models. Depending on plan tier, users can switch between Nano Banana, Nano Banana 2 and Nano Banana Pro, GPT Image 2.5 Sunburst, GPT Image 2.5 Flare, GPT Image 2 and GPT Image 1.5, SeeDream 4.5, Seedream 5.0 Lite and Flux.2 Max, with journal-inspired palettes and style presets for consistency across a manuscript. The company states that the platform is trained across life sciences, engineering, physics, chemistry and computer science rather than biology alone, and that it serves a market of more than 30 million researchers and students worldwide. That claim is supported by a homepage gallery of figures published in journals such as Cell, Cell Research, Nature Cell Biology, the Journal of Hepatology, Global Change Biology and Ageing Research Reviews, alongside a badge noting that over 600,000 researchers from leading institutions use the service.
For developers and AI-native researchers, FigureLabs exposes the same engine through a public REST API and a hosted MCP server. The API accepts asynchronous generation requests at a single endpoint, returns a task identifier, and lets a product poll for a result before downloading the output URL, with automatic routing across text-to-figure, sketch-to-figure, reference-image-to-figure, enhance, flowchart, upscale and vectorize workflows. The MCP server connects the platform to ChatGPT, Codex, Claude and other MCP-compatible assistants using an existing FigureLabs account, credits and workspace, so a paper's context never has to leave the conversation.
FigureLabs Core Features
Text-to-figure generation that turns methods sections, abstracts and PDFs into publication-ready scientific illustrations
AI flowchart maker for PRISMA, CONSORT, study design, model architecture and process diagrams
Scientific plot generator that converts CSV, Excel or pasted statistics into Nature-style bar, box, heatmap, volcano and violin plots
Infinite editing canvas with Region Redraw, Text Edit, Recolor, Background Removal and aspect ratio controls
Vectorization and export to fully editable layered SVG or PPTX, plus PNG and JPG up to 8K resolution
Access to multiple leading image models, including GPT Image 2.5, Nano Banana Pro, SeeDream 4.5 and Flux.2 Max
Visual consistency controls that lock icons, arrows, fonts and palettes across every figure in a paper
Developer API and MCP server for ChatGPT, Codex and Claude, sharing one account, plan and credit balance
Who is FigureLabs for?
FigureLabs is built for the people who write and publish research: principal investigators, postdocs, PhD students, lab managers, medical writers and academic authors who need to explain complex science visually but have no formal design training. Life scientists use it for signaling pathway diagrams, graphical abstracts and mechanistic illustrations, while clinical and medical researchers use it for anatomical illustrations, mechanism-of-action figures and patient or trial flow diagrams. Engineers, physicists, chemists and computer scientists use it for experimental setup diagrams, device schematics, material structures and neural network architecture charts. It is equally relevant to anyone assembling a manuscript, thesis, grant proposal, conference poster or slide deck from methods text, statistics or raw datasets. The platform also suits teams rather than individuals. Labs, departments and research groups can invite collaborators to comment on a shared canvas, lock icons, arrows, fonts and palettes so every figure in a paper looks consistent, and keep projects and version history in one workspace. Institutions that generate figures repeatedly can connect the FigureLabs API to a product or internal tool, or attach the MCP server to ChatGPT, Codex or Claude so figures are created inside the conversation where the paper is already being written. Finally, FigureLabs fits students and non-academic professionals who simply lack a figure tool. Undergraduates writing lab reports and theses, science communicators, medical affairs teams and data analysts all get publication-grade output without learning Adobe Illustrator or building a library of pre-made icons. Anyone who has ever pasted a hand-drawn sketch into PowerPoint and given up can start from text, a photo or a spreadsheet instead and finish with an editable vector file.
FigureLabs Use Cases
Creating a graphical abstract that summarizes the background, intervention mechanism and main finding of a study
Turning a signaling pathway or mechanism of action into a labeled diagram for a manuscript
Building PRISMA or CONSORT flow diagrams and clinical trial screening workflows directly from a protocol
Plotting omics and experimental data as volcano plots, heatmaps, dose-response curves or Kaplan-Meier curves
Producing device schematics, experimental setup diagrams and 3D material structures for engineering papers
Drafting model architecture, data pipeline and algorithm flowcharts for machine learning publications
Repairing, redesigning or vectorizing an existing figure that a journal rejected for quality
Generating figures inside ChatGPT, Codex or Claude through the FigureLabs MCP server while writing
FigureLabs Pros and Cons
Pros
- Purpose-built for research rather than generic image generation, so outputs match journal conventions out of the box
- Editable vector export plus a publication authorization certificate remove the usual journal objections to AI figures
- One subscription unlocks several frontier image models instead of requiring separate accounts and API keys
- Transparent credit pricing and a genuinely usable free tier let you test the workflow before paying
- API and MCP server let individuals and teams automate the same figure engine programmatically
Cons
- Credits are consumed by every generation, edit and export, so heavy figure work adds up quickly
- The free plan is non-commercial and capped at 1K exports, flowchart and plot modes and two models
- Advanced model access, SVG and PPTX export, the built-in canvas and publication rights sit behind paid plans
FAQ About FigureLabs
FigureLabs Pricing
Freemium. The free plan includes 150 one-time credits, 50 daily refresh credits, 1GB storage, 1K HD export, flowcharts and plots, and access to two models, but is non-commercial only. Paid plans start at $9 per month billed annually (Starter), rising to $16 per month (Plus), $45 per month (Pro), $20 per seat per month (Team) and custom pricing for Business. Yearly billing saves up to 55%. Credits are consumed per generation, edit and export, and paid users get 100 daily refresh credits.
Check official pricingFree
150 one-time credits, 50 daily refresh credits, 1GB storage, 1K HD image export, flowcharts in SVG and plots, access to 2 models (Nano Banana Pro, GPT Image 2). Non-commercial use only.
Starter
1,000 credits per month, 10GB storage, 4K HD export, vector SVG and editable PPTX export, built-in canvas, publication authorization and access to 7 models. Billed annually at $120 per year.
Plus
5,000 credits per month, 50GB storage, 8K HD export, vector SVG and PPTX export, built-in canvas, publication authorization and access to 10 models. Billed annually at $420 per year; the most popular tier.
Pro
20,000 credits per month, 300GB storage, 8K HD export, every export format and all 10 models including Flux.2 Max and Seedream 5.0 Lite. Billed annually at $1,188 per year.
Team
5,000 credits per seat per month, 60GB storage, 100 daily refresh credits, credit rollover up to 20% of the plan and all paid features including publication authorization.
Business
20,000 credits per seat per month, 400GB storage, credit rollover up to 20% of the plan and all paid features. Priced through a contact sales form; the team replies within 1-3 business days.
FigureLabs Alternatives

OpenMov
OpenMov is a browser-based creative suite for AI video and image work. It covers video generation, image-to-video, video-to-video, upscaling, lipsync, merging, text-to-image, image editing and face or head swaps from one workspace. Generation runs on a shared credit balance bought in pay-as-you-go packs, with no subscription, credits that never expire and automatic refunds for failed generations.

Fetra
Fetra AI is a web-based creative suite that combines a conversational AI Director, a multi-model video and image Create studio, Viral Remix templates, an AI Avatar library, free text-to-image and image-to-image generation, an asset library, and social publishing. It brings leading models such as GPT Image 2, Nano Banana 2, Seedance, Veo, and Kling into one credit-based workspace for creators, brands, and teams.

Sogni AI
Sogni runs the Supernet, a decentralized GPU network powered by independent workers instead of data centers. The platform brings 200+ frontier image, video, music, and language models under one account, with a free tier for on-device rendering, pay-as-you-go Spark credits, and flat-rate Unlimited plans for credit-free fair-use access, plus SDK and API access for developers.